


Feature Focus: Are cancer-screening tests worth taking?
Volume 12, Issue 1 | June 5, 2025


Feature Focus Commentary
Cancer screening is high-stakes. A true positive is life-changing and life-saving. To a lesser degree, so is a false positive - it triggers unnecessary follow-up tests, delays, stress, cost, and (if a biopsy is involved) trauma and health risk. A false negative is a whole different ball game, as a missed or delayed diagnosis is often deadly. So what makes a test “good enough” to be worth taking, and how can you tell? (For the tl;dr version, skip to the bottom of this post.)
What you really need to know
You have the result, either positive or negative. Now you need to know what the chances are that your result is true.
If I test positive, how likely is it that I really have cancer? In statistics, this is called the positive predictive value (PPV).
If I test negative, how likely is it that I am really cancer-free? This is the negative predictive value (NPV).
Unfortunately, tests aren’t usually advertised based on their PPV and NPV. Instead, we generally hear about the sensitivity and specificity of a given test, which are not the same thing at all. Here’s what those tell you.
Sensitivity: If I have the disease, how likely is it that I will get a positive result?
Specificity: If I do not have the disease, how likely is it that I will get a negative result?
The problem with sensitivity and specificity is that they are both based on knowing whether you have the disease or not. And of course you don’t know whether you have the disease - that’s why you took the test in the first place!
To illustrate the differences, let’s look at a real-world example. The results shown here are drawn from a trial that was reported in The Lancet. The study was evaluating a multi-cancer early-detection test.
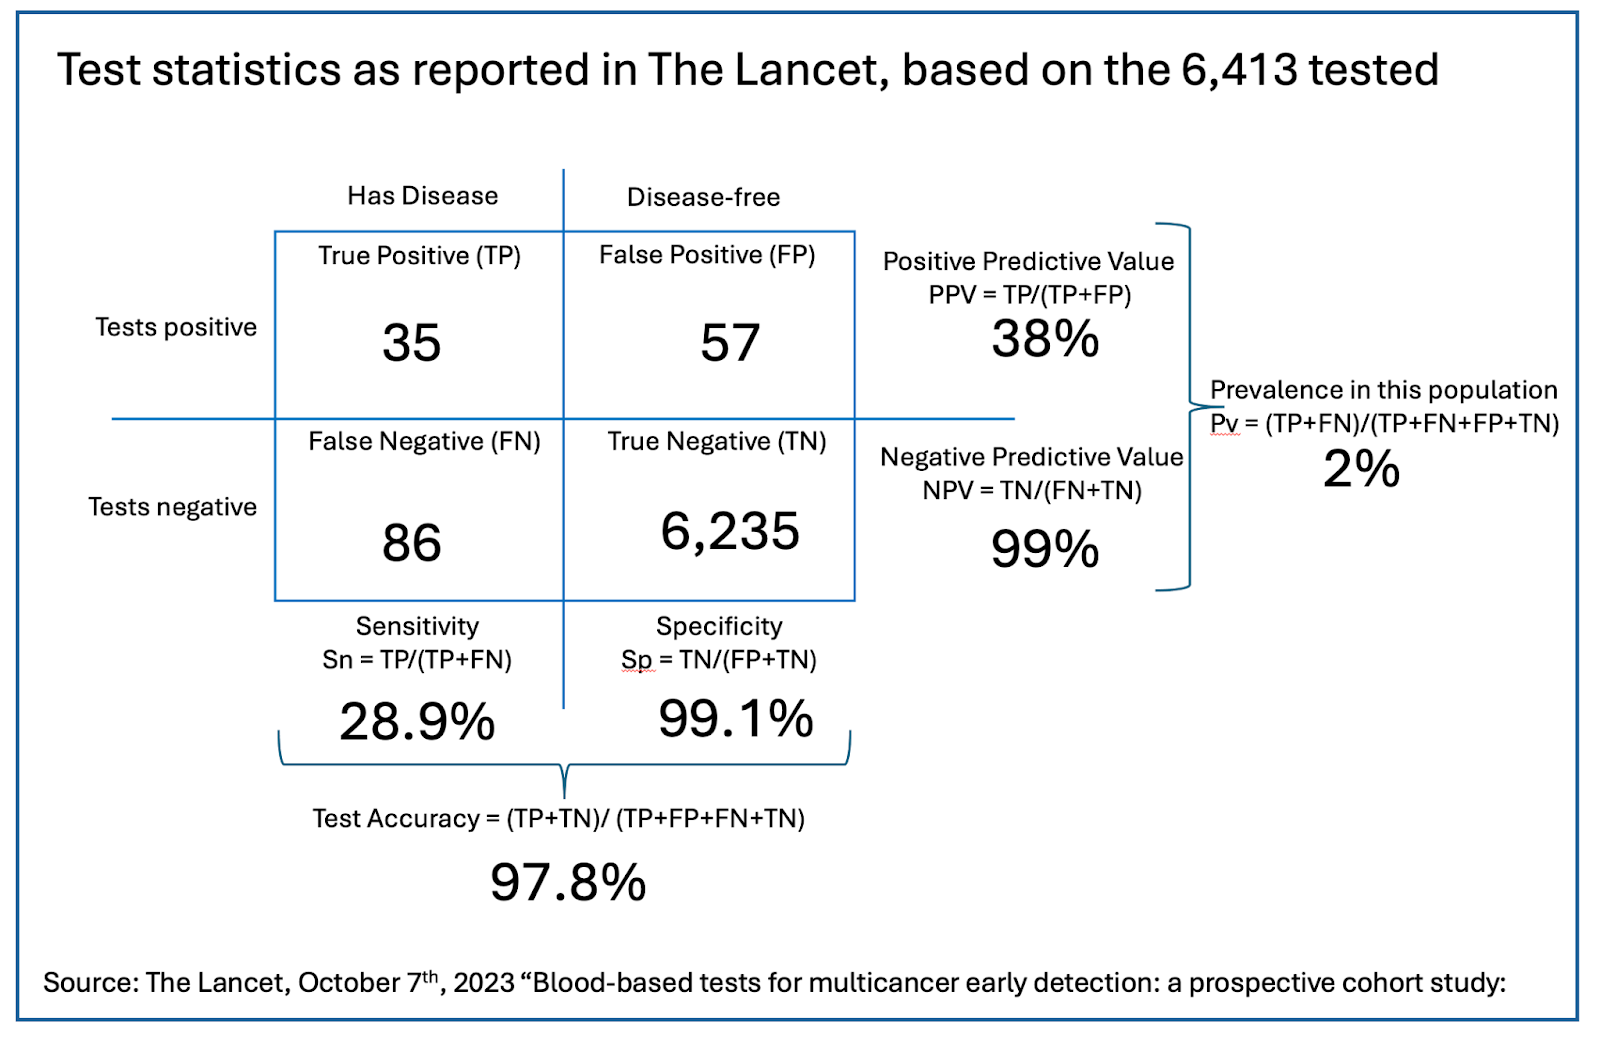
This test is not very sensitive. Its sensitivity is 29% (28.9%). That means that the test catches just 29% of those who have cancer, missing 71% of cases. So if your result is positive, what is the chance you really have cancer? That’s your PPV. It’s just 38%. That means that even with a positive result, it is still almost twice as likely that you are actually cancer-free.
On the other hand, this test is quite specific. The 99.1% specificity means that ninety-nine percent of people who didn’t have cancer tested negative. The test also has a very high NPV: 99% of those with a negative result really are cancer-free. So if you test negative, you can have much greater confidence that cancer has been ruled out.
“Good enough” depends on context
Before we pass judgment on this test, we also have to remember that these numbers come from a trial that was submitted to argue that the test works. Understandably, clinical trials for cancer-detection tests need to include a reasonable number of people who have cancer but don’t know it yet. (The test has to have something to find.) For that reason, most test-approval applications feature a group of people in which the prevalence of the disease in question is higher than it is in the general population. This is often called an enriched population.
In this trial, 121 of the 6,413 people recruited (1.9%) turned out to have cancer. That is about four times the average for the US population as a whole (0.4%), but quite close to the actual annual incidence in the over-50-year-old folks recruited for the study.
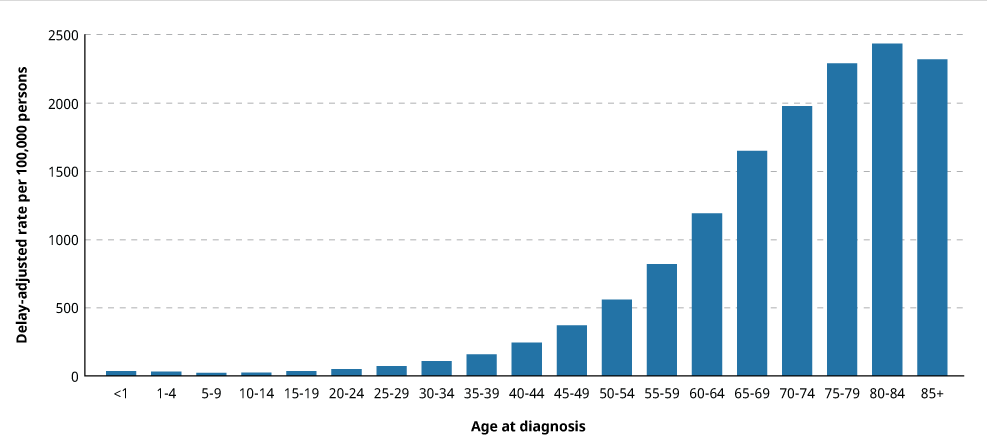
But what about folks in younger age groups, who might be tempted to take a screening test like this? For illustration, we reworked the predictive values of this test in a population in their 40s, where cancer prevalence is much lower - about 0.3%. (You can work the math for yourself, or for those who really want to get into the weeds, you can play with the numbers using this handy little tool from Chris Ferrie that allows you to choose sensitivity, specificity, and prevalence to visualize a test’s predictive value in any subgroup of a tested population.)
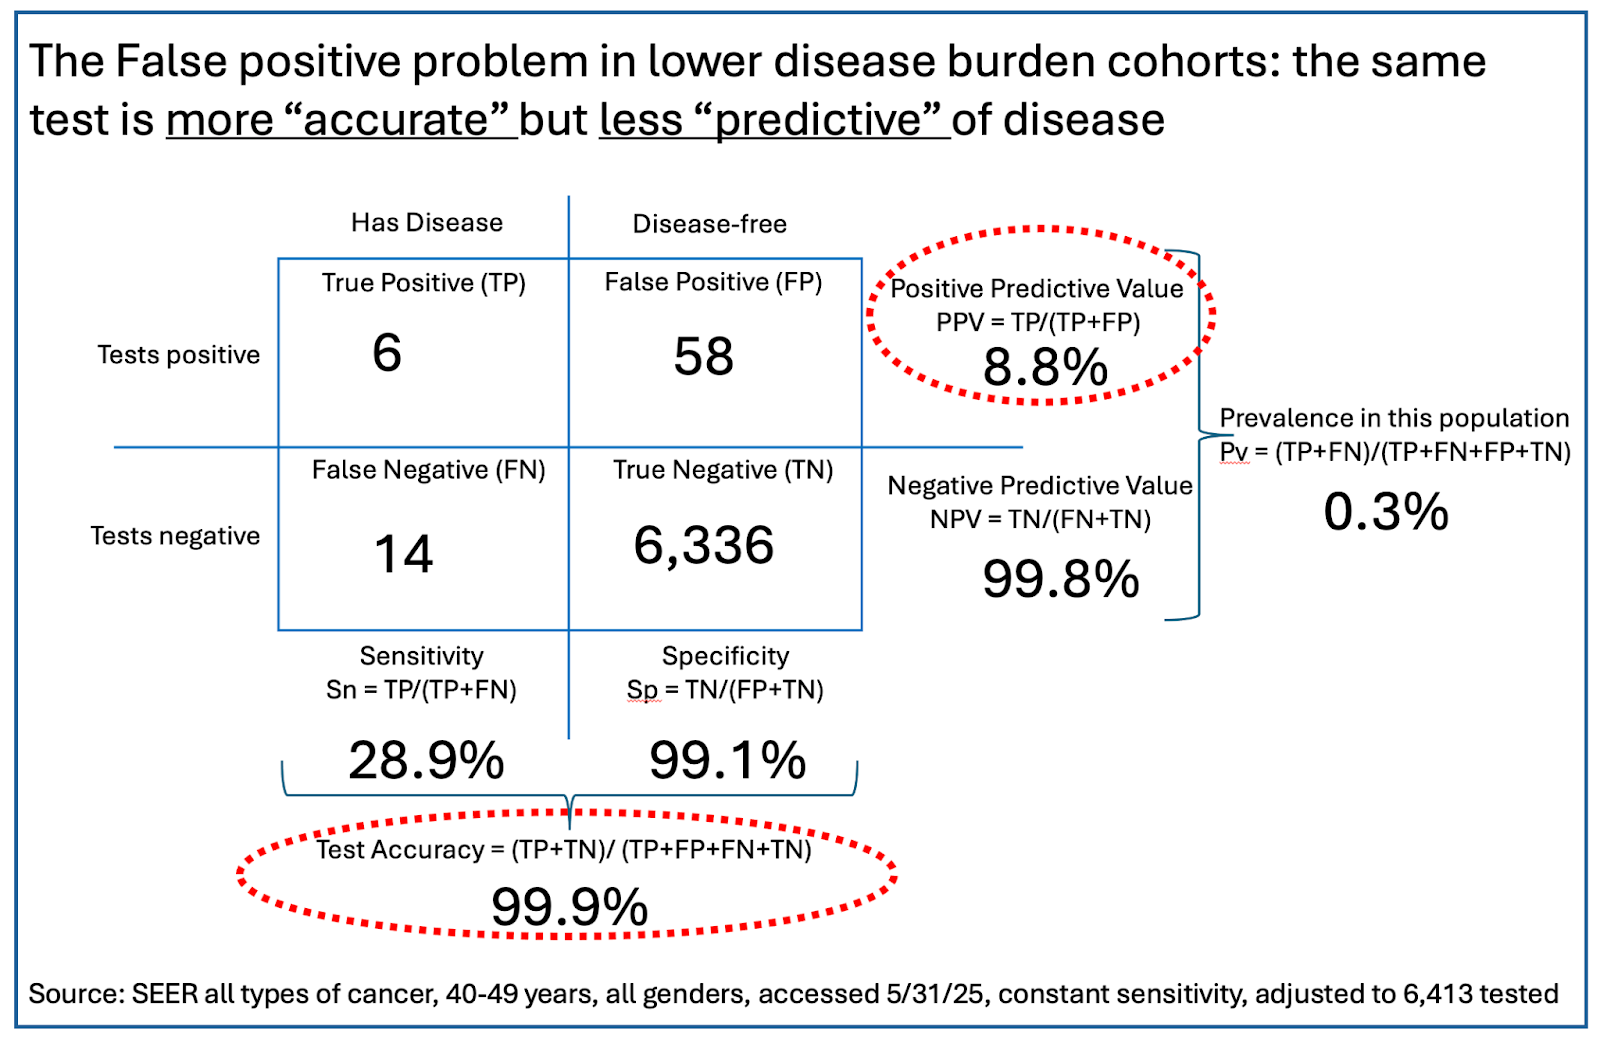
Perhaps counterintuitively, in this population the accuracy of the test (accuracy = a combination of sensitivity and specificity) has gone up by a little - from 97.8% to 99.9%. However, even with the same test performance in terms of sensitivity and specificity, that lower prevalence skews the PPV by a lot. The test’s reliability if you get a positive has dropped from 38% to just 9% - a positive test is now wrong nearly 91% of the time! But the NPV has gotten really good: If you test negative on this test, you almost certainly don’t have cancer. That said, folks in this younger population were 99.7% likely to not have cancer before taking the test. Their certainty has gone up by just 0.1%. Is this what we want a good cancer-screening test to do?
This test was indeed approved. Its 29% sensitivity is actually higher than average for tests that look for early-stage cancers.
On the one hand, this test is quite good at ruling out cancer. However, it’s weak at its main job. Cancer-screening tests exist to find people who have cancer before they have clear symptoms, since treatment is more successful if initiated at earlier stages. So how do we make things better?
Two options for improvement
Screening an otherwise healthy population for a serious disease that has very low real-world presence using a test that misses cases twice as often as it finds them must always be questionable. Focusing on higher-risk people instead seems to make much more sense. We see two ways to do that.
One approach is to use multi-cancer early detection tests (MCEDs) in people who have symptoms or risk factors that could raise cancer probability. (We reported on a trial that evaluated one MCED test in that context.) This is a higher-risk group (about 7% chance of having disease, versus the roughly 0.5% average), improving predictive value.
A related but different approach would be to focus on early cancer detection, but only for one cancer at a time instead of multiple cancers. Two examples of this strategy would be the use of low-dose CT or liquid biopsy genomic tests on current and former smokers.
At some level, screening must always be a search for the proverbial needle in a haystack. Making the haystack smaller will help make the needle easier to find and the tools we have work better.
TL;DR Summary
What you really want to know is what either a positive or negative test result means for you given your particular history and risk factors. In terms of test statistics, the closest thing to that is the positive predictive value (PPV: the likelihood that a positive test is correct) and negative predictive value (NPV: the likelihood that a negative test is correct).
What you typically hear about are sensitivity and specificity. The higher each of these is, the better. However, neither of these statistics tell you what your result predicts for you.
The prevalence of a condition in the population being tested matters a lot. The lower the prevalence, the higher the number of false positives and the worse the PPV. In the example we used, an already low-ish 38% PPV in a trial population with 2% prevalence drops to 9% in a younger population with a prevalence of 0.3%. If the PPV of a test is lower than the average prevalence in the real world, the test is of little functional value.
Two fundamental questions remain.
Do physicians and other health-care professionals understand these issues? Our guess is that they don’t. As we have said many times in the past, diagnostics and related statistics are not taught in medical schools and usually aren’t included in medical continuing education. That has to change. As regular readers know, the coming years will see an onslaught of new tests in the clinic, especially for diagnosing neurodegenerative disease. Unless physicians understand and can explain the results of these tests, they will create more confusion than clarity.
Where can the average consumer or patient get the data that will allow them to properly evaluate a given test? For FDA-approved tests, the data can be found on the agency’s website along with the details of the test’s approval letter. It can also be found on the manufacturer’s website. But good luck to any average user trying to locate those pages or understand the extremely technical language they’ll see there. If the test is a laboratory-developed test (LDT), the information may be even more difficult to find - it may be buried inside publications on the lab’s website.

Bird Flu: Virus can survive over a week in refrigerated raw milk
New rapid bird flu test can be used in multiple species
According to a new preprint, bird flu virus can survive in refrigerated raw milk for over a week. Previous research has shown that pasteurization kills the virus.
Researchers have developed a low-cost, rapid test for avian flu that can be used in multiple species, including humans, poultry, cattle, wild birds, and others. The test can use either an oral or a nasal swab and targets the H5 hemagglutanin gene of the virus (that’s the “5” in H5N1).
Measles:
With no new cases since April 21, public-health officials in Allen County, Indiana, have declared the outbreak there over.
The current larger outbreaks are shown below. The cases in Texas, New Mexico, Kansas, and Oklahoma all came from the same source; those in Arkansas, Colorado, Michigan, Montana, North Dakota and Ohio are unrelated.
